Simple microprice research
This example asks a deliberately small market-microstructure question: does visible bid/ask imbalance contain information about the midpoint 300 milliseconds later, either on the same venue or across venues?
It uses the same raw files and the same Bitcoin five-minute interval as the cross-venue order-book reconstruction: the dedicated Polymarket Bitcoin Up/Down capture and the matching HyperLiquid BTC perpetual checkpoint plus hourly diffs. During the Docker build those large files are downloaded once, then shared by both analyses.
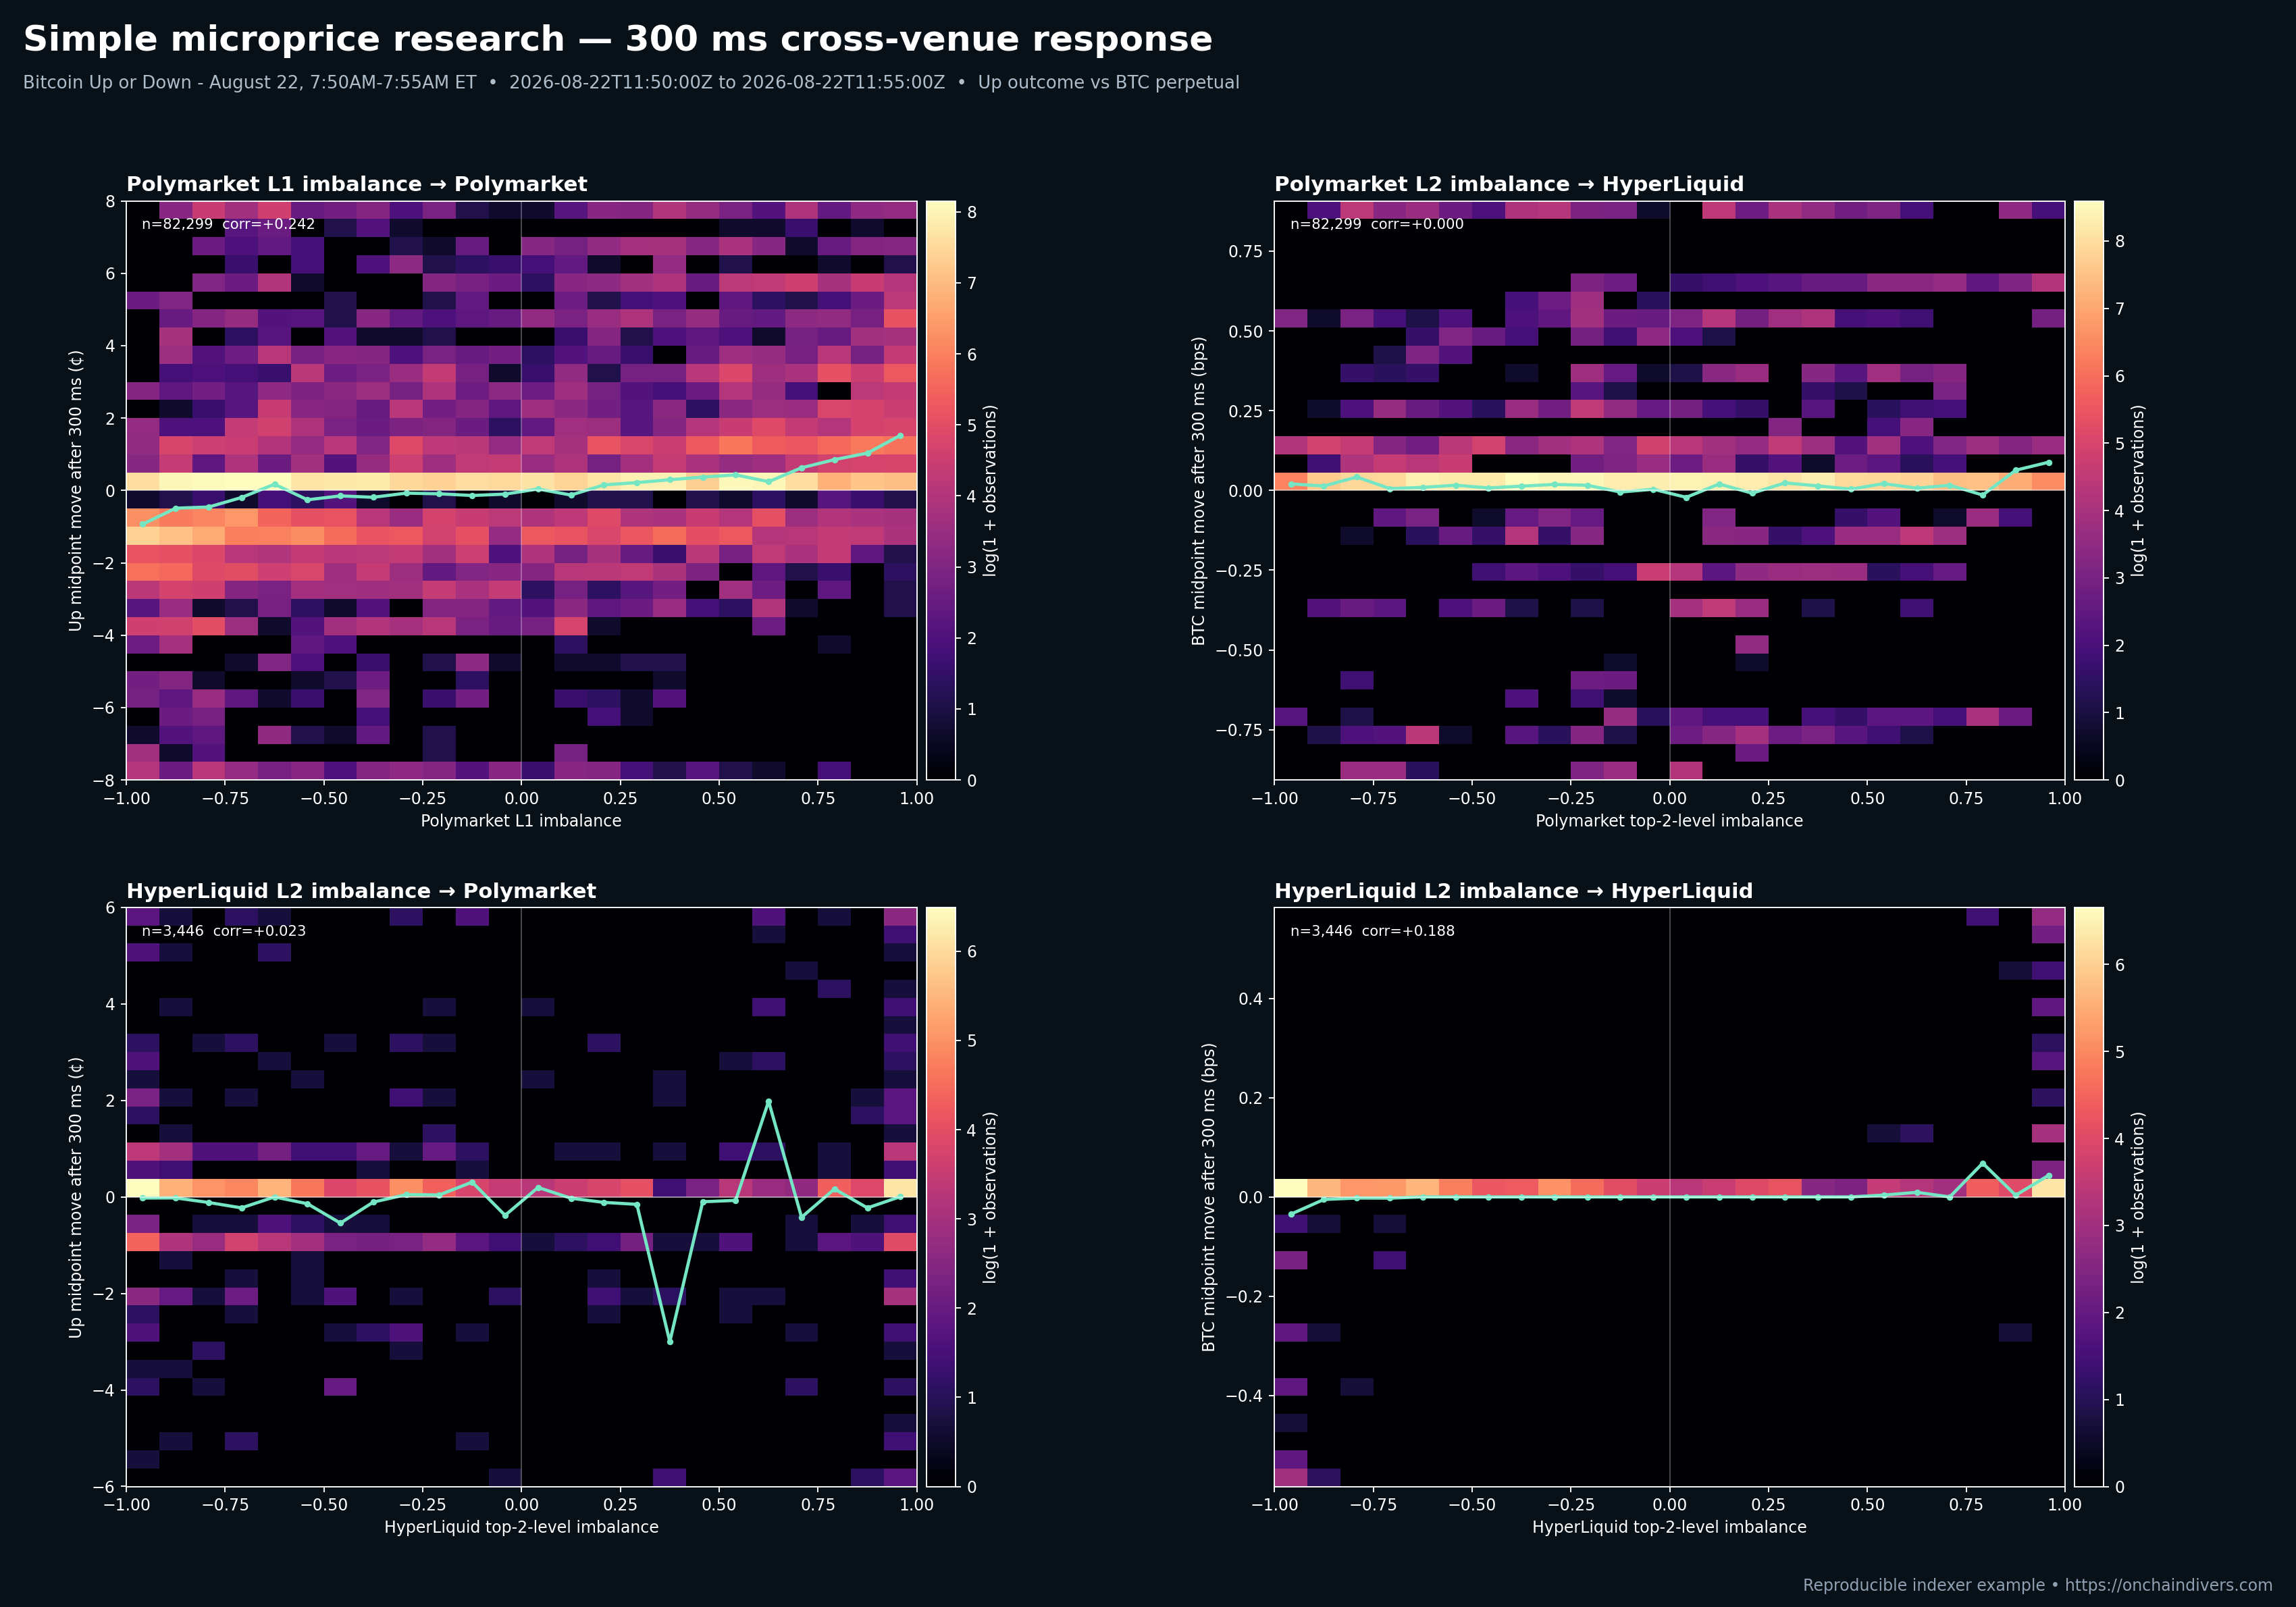
The image is regenerated from a recent historical interval during every strict documentation build. It is not a static research result checked into the site.
Microprice and imbalance
For best bid price P_b, best ask price P_a, displayed bid size Q_b, and
displayed ask size Q_a, normalized order-book imbalance is:
I = (Q_b - Q_a) / (Q_b + Q_a)I lies between -1 and +1. Positive values mean more displayed size rests
at the bid; negative values mean more rests at the ask.
The level-one microprice weights each quote by the size on the opposite side:
microprice = (P_a × Q_b + P_b × Q_a) / (Q_b + Q_a)
= midpoint + (spread / 2) × IThis orientation is intentional. A relatively large bid queue moves the microprice toward the ask, while a relatively large ask queue moves it toward the bid. The microprice equals the ordinary midpoint when both displayed sizes are equal.
For the two-level studies, Q_b is the sum of sizes at the best two bid prices
and Q_a is the sum at the best two ask prices. This is a simple depth-imbalance
extension: the price in the microprice formula remains level one, while the
signal sees slightly deeper liquidity.
The four heatmaps
The Polymarket series uses the Bitcoin Up outcome. Every predictor state is
paired with the most recent target-venue midpoint observable at time t and at
t + 300 ms.
- Polymarket L1 imbalance → Polymarket move. The response is the Up-token midpoint change in cents after 300 ms.
- Polymarket L2 imbalance → HyperLiquid move. The response is the BTC perpetual midpoint return in basis points after 300 ms.
- HyperLiquid L2 imbalance → Polymarket move. The response is the Up-token midpoint change in cents after 300 ms.
- HyperLiquid L2 imbalance → HyperLiquid move. The response is the BTC perpetual midpoint return in basis points after 300 ms.
Cell color is log(1 + observations), so dense zero-move regions do not hide
sparser tails. The green line is the mean future movement inside each imbalance
bin. Every panel reports its aligned observation count and the raw Pearson
correlation between imbalance and the future move.
Replay and clock alignment
examples/cross_venue/microprice_research.py does not infer size from the
best-bid/ask chart stream. It performs full book reconstruction:
- Polymarket
bookmessages replace the complete selected outcome book; subsequentprice_changemessages update or remove individual price levels. Messages sharing a recorder millisecond are applied atomically. A rare incomplete recorder state that remains crossed after grouping is omitted, while its mutations are retained for the next complete state. - HyperLiquid starts from the BTC order-ID checkpoint and applies every new, update, and remove diff. Updates sharing a block timestamp are applied before the state is sampled, avoiding artificial half-block books.
- Both venues retain event-time states at millisecond precision. Alignment uses an as-of lookup: the state at a requested instant is the last state known at or before that instant. If no update occurs during 300 ms, the measured move is correctly zero.
The script writes a JSON summary beside the image containing the interval, state counts, horizon, observation counts, correlations, plot ranges, and output path.
Run it reproducibly
The standalone command selects and downloads its own recent interval:
docker build --target checker-base -t onchaindivers-docs:checker-base .
docker run --rm \
--env-file .env \
--volume "$PWD/docs/public/examples:/app/docs/public/examples" \
onchaindivers-docs:checker-base \
python3 -u examples/cross_venue/microprice_research.pyThe full documentation checker is more efficient: it downloads the raw market
once and calls run_downloaded() for both cross-venue examples before deleting
the temporary inputs.
Interpretation limits
This page demonstrates a reproducible workflow, not a trading claim. One five-minute interval is far too small for inference; displayed depth can be cancelled; venue clocks and network delivery paths differ; and the study does not model queue position, fees, latency, fills, or market impact. A serious backtest should repeat the same pipeline over many non-overlapping markets, retain out-of-sample periods, and include executable-price and cost assumptions.
Data access and additional indexer examples are available from OnchainDivers.